This webpage shows the results accompanying the figures in the thesis (CCS Reservoir Simulation using Graph Neural Networks, retrievable at https://repository.tudelft.nl/). Contact: ljjveeger@gmail.com
Variable injection
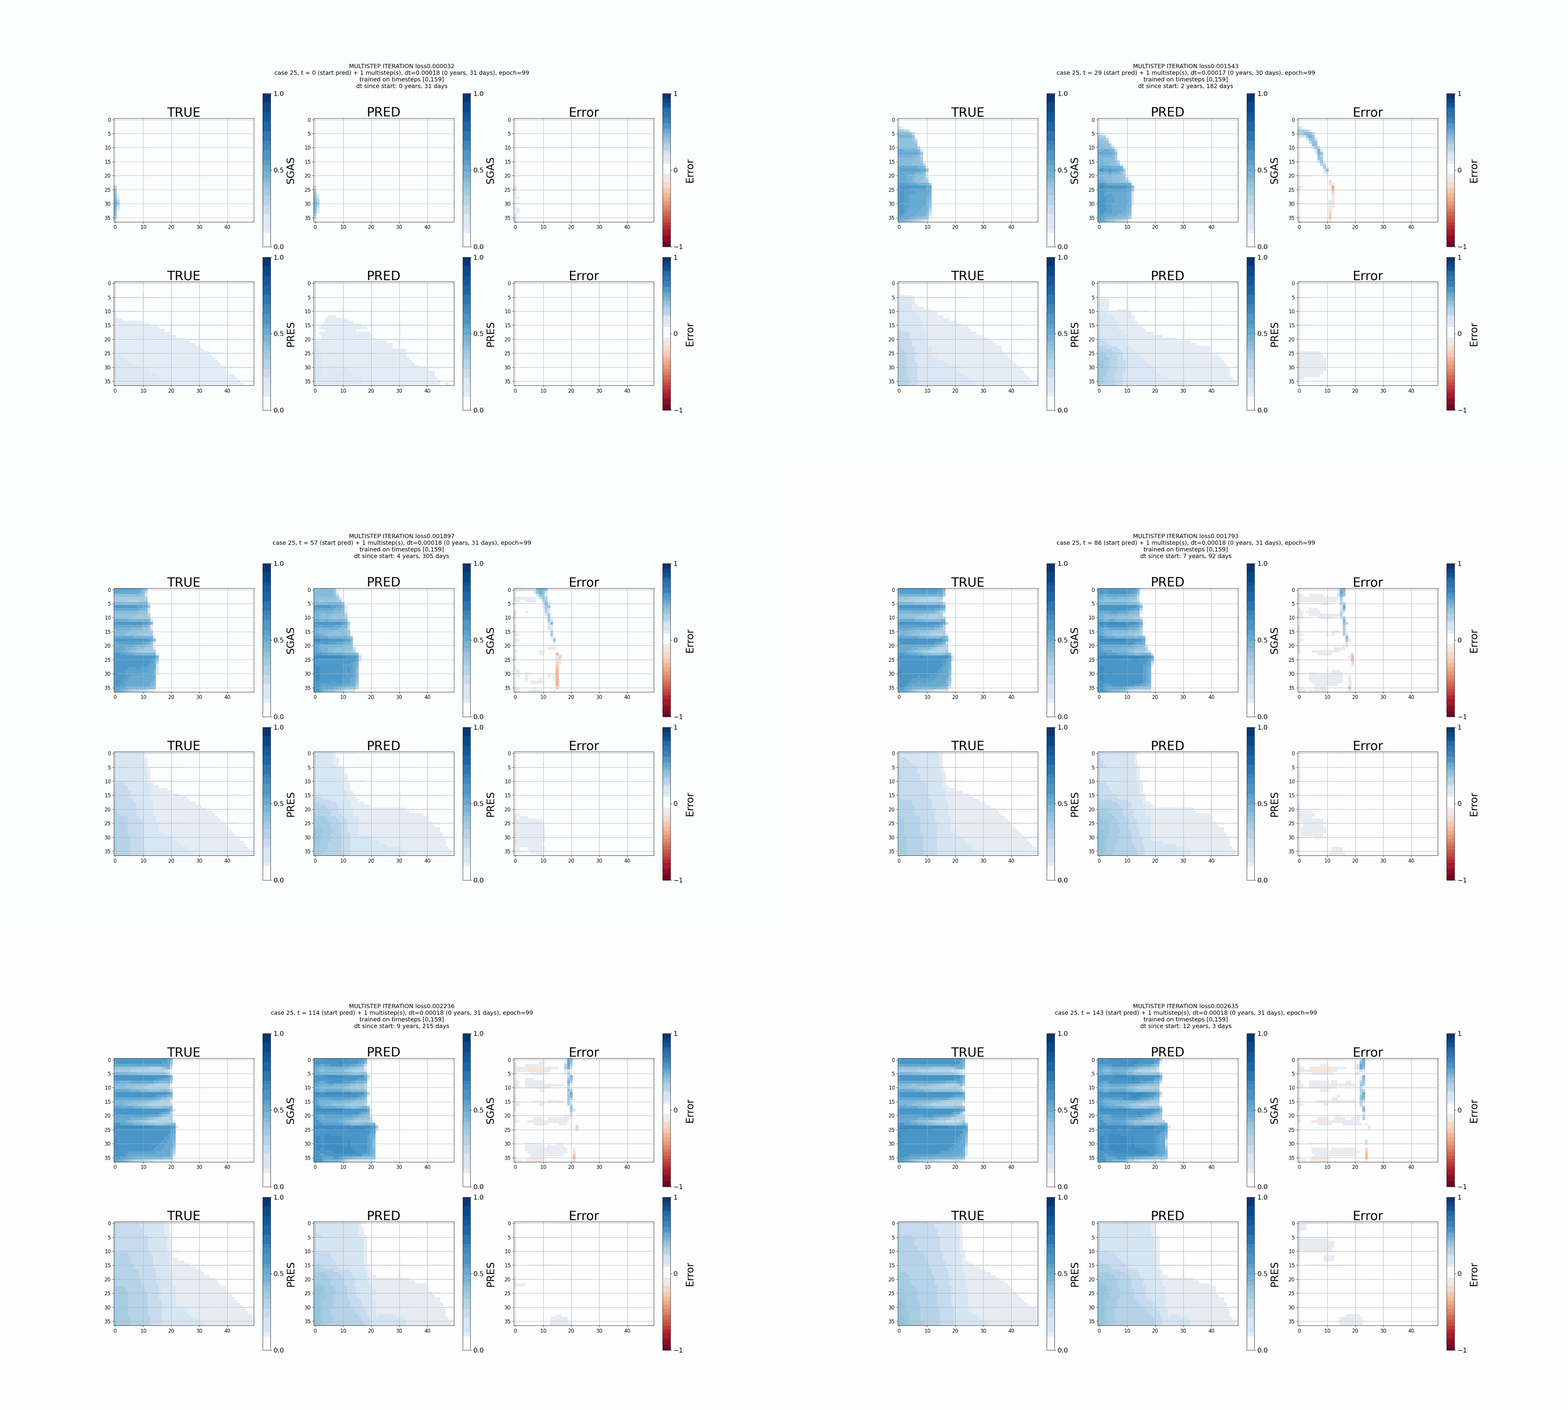
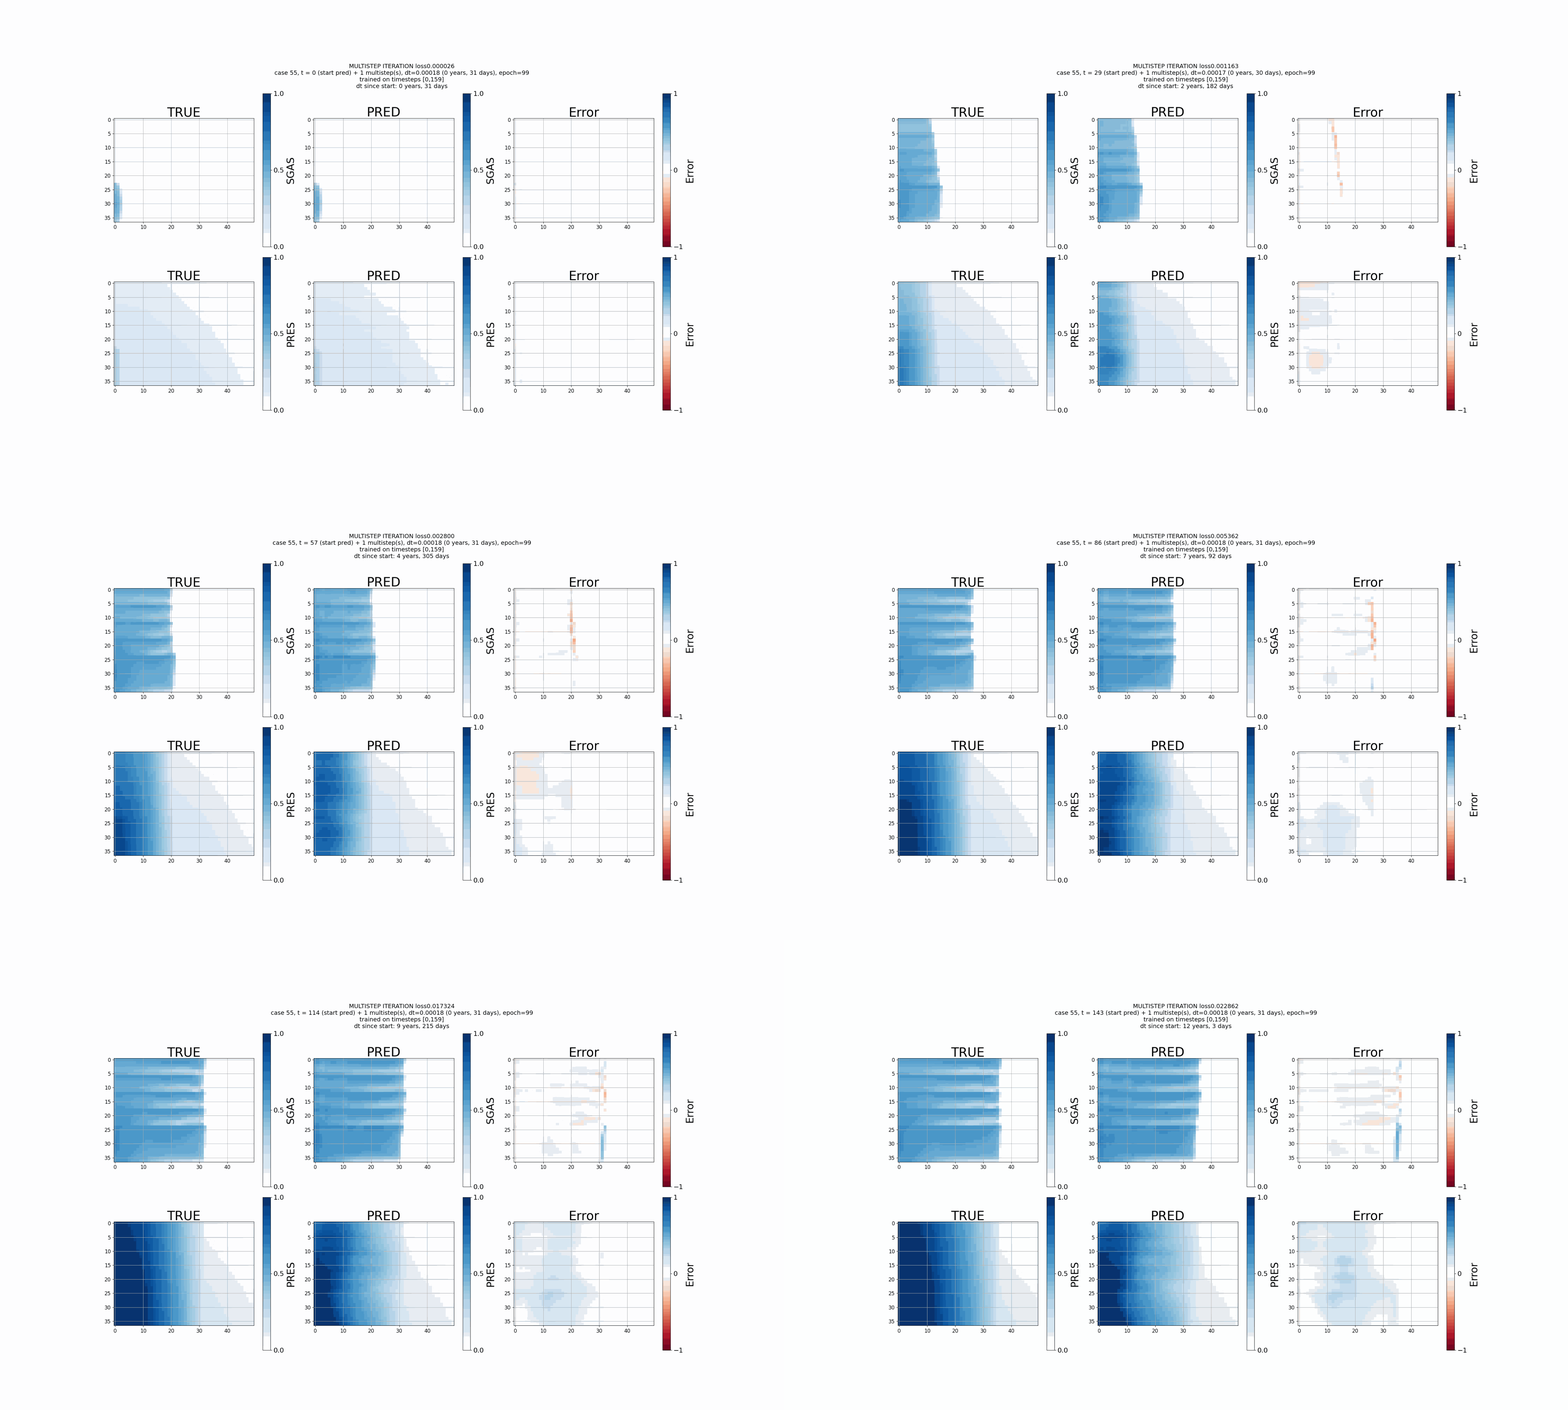
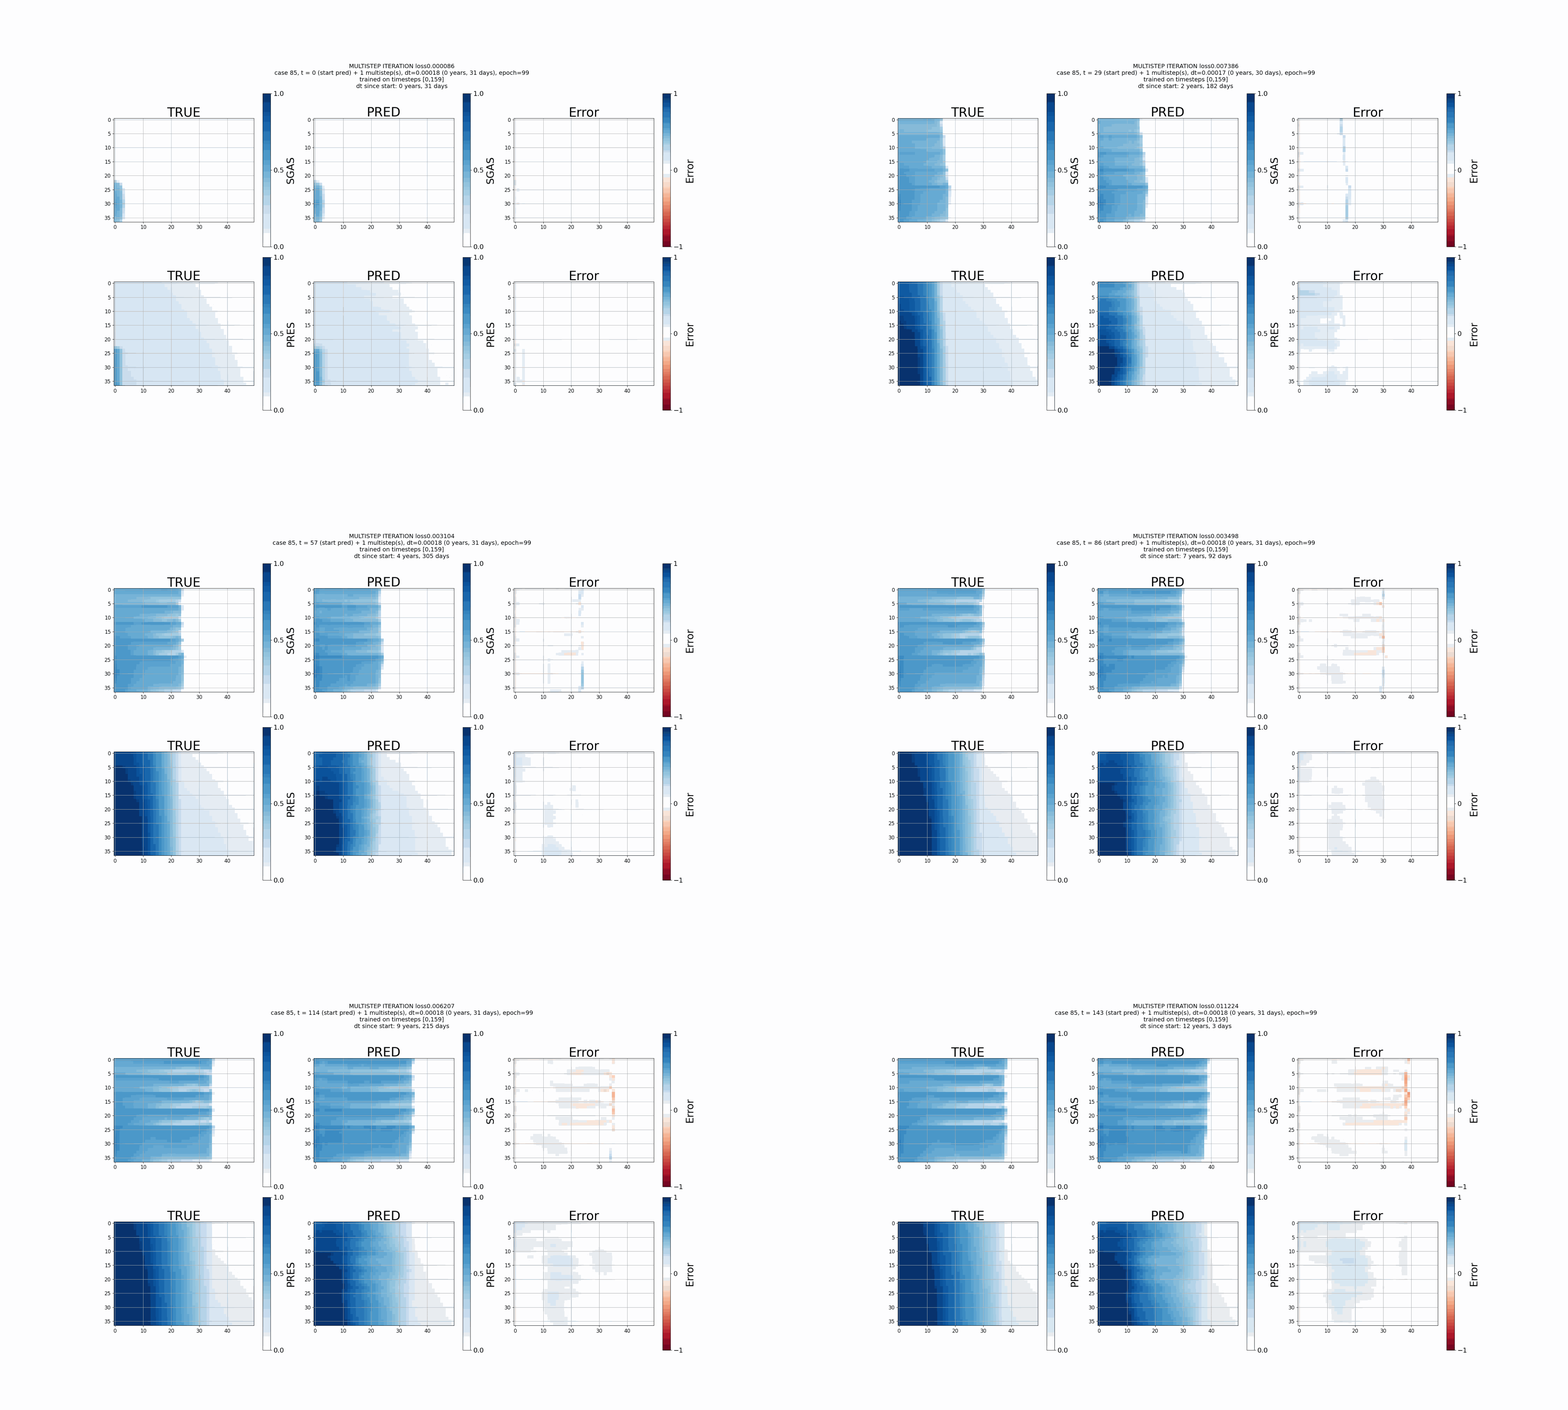
(Figure 5.2 & 5.3)
Case 25
Case 55
Case 85
Variable shale
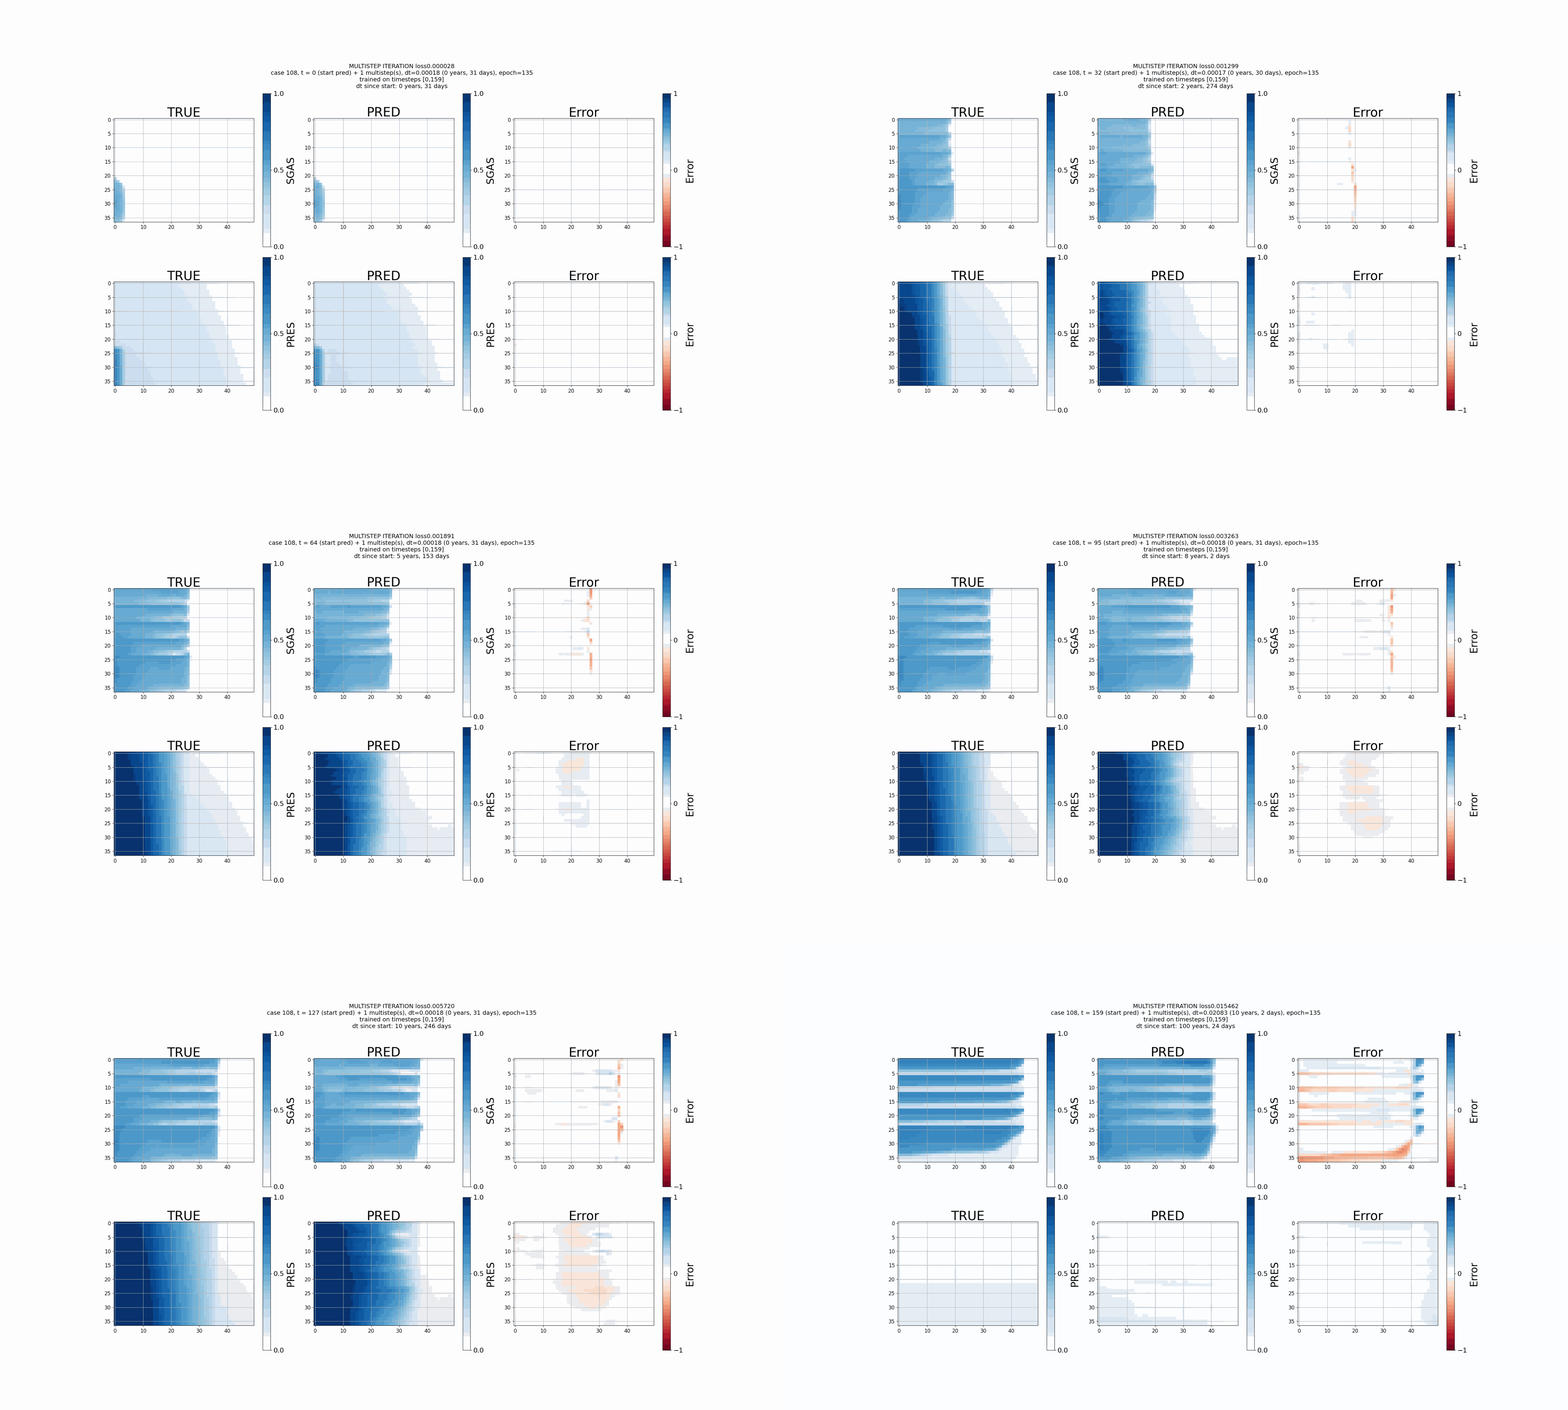
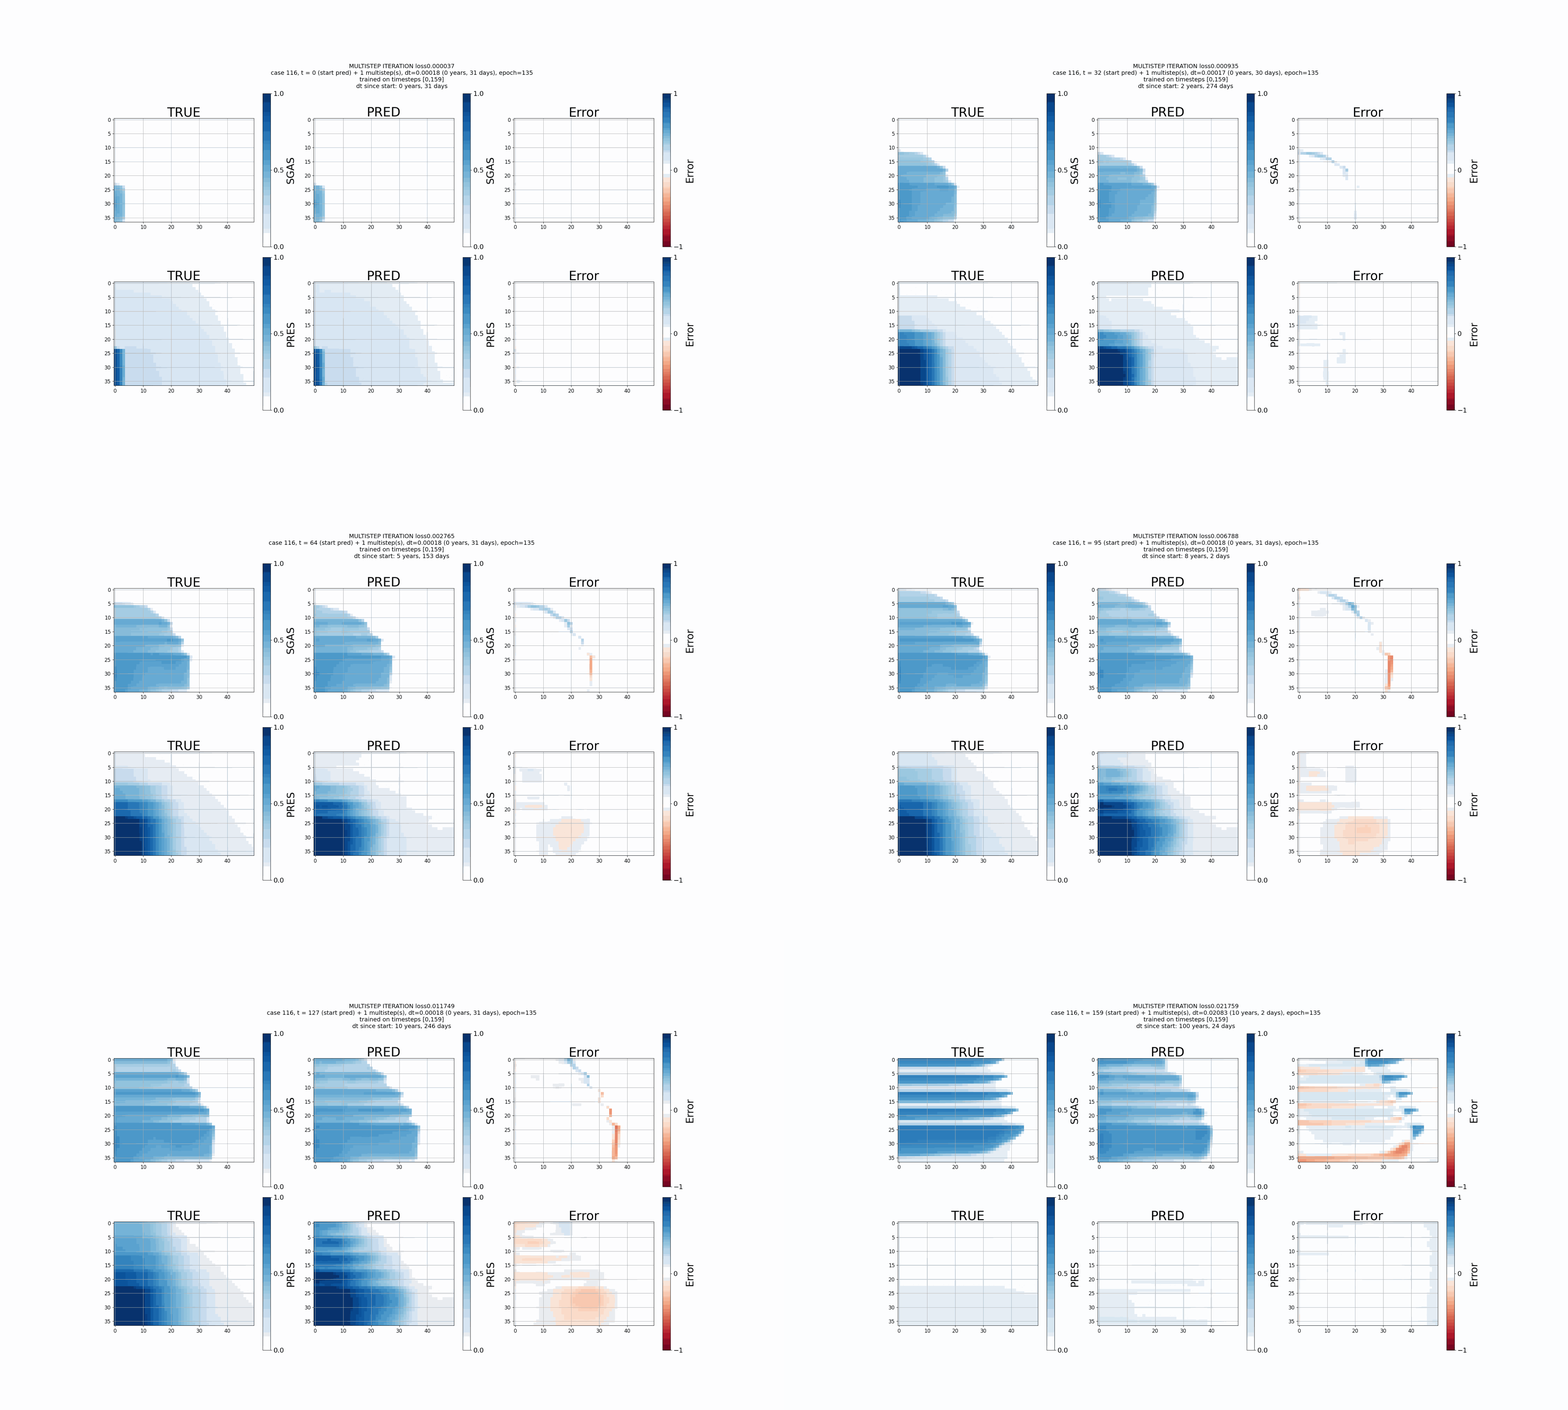
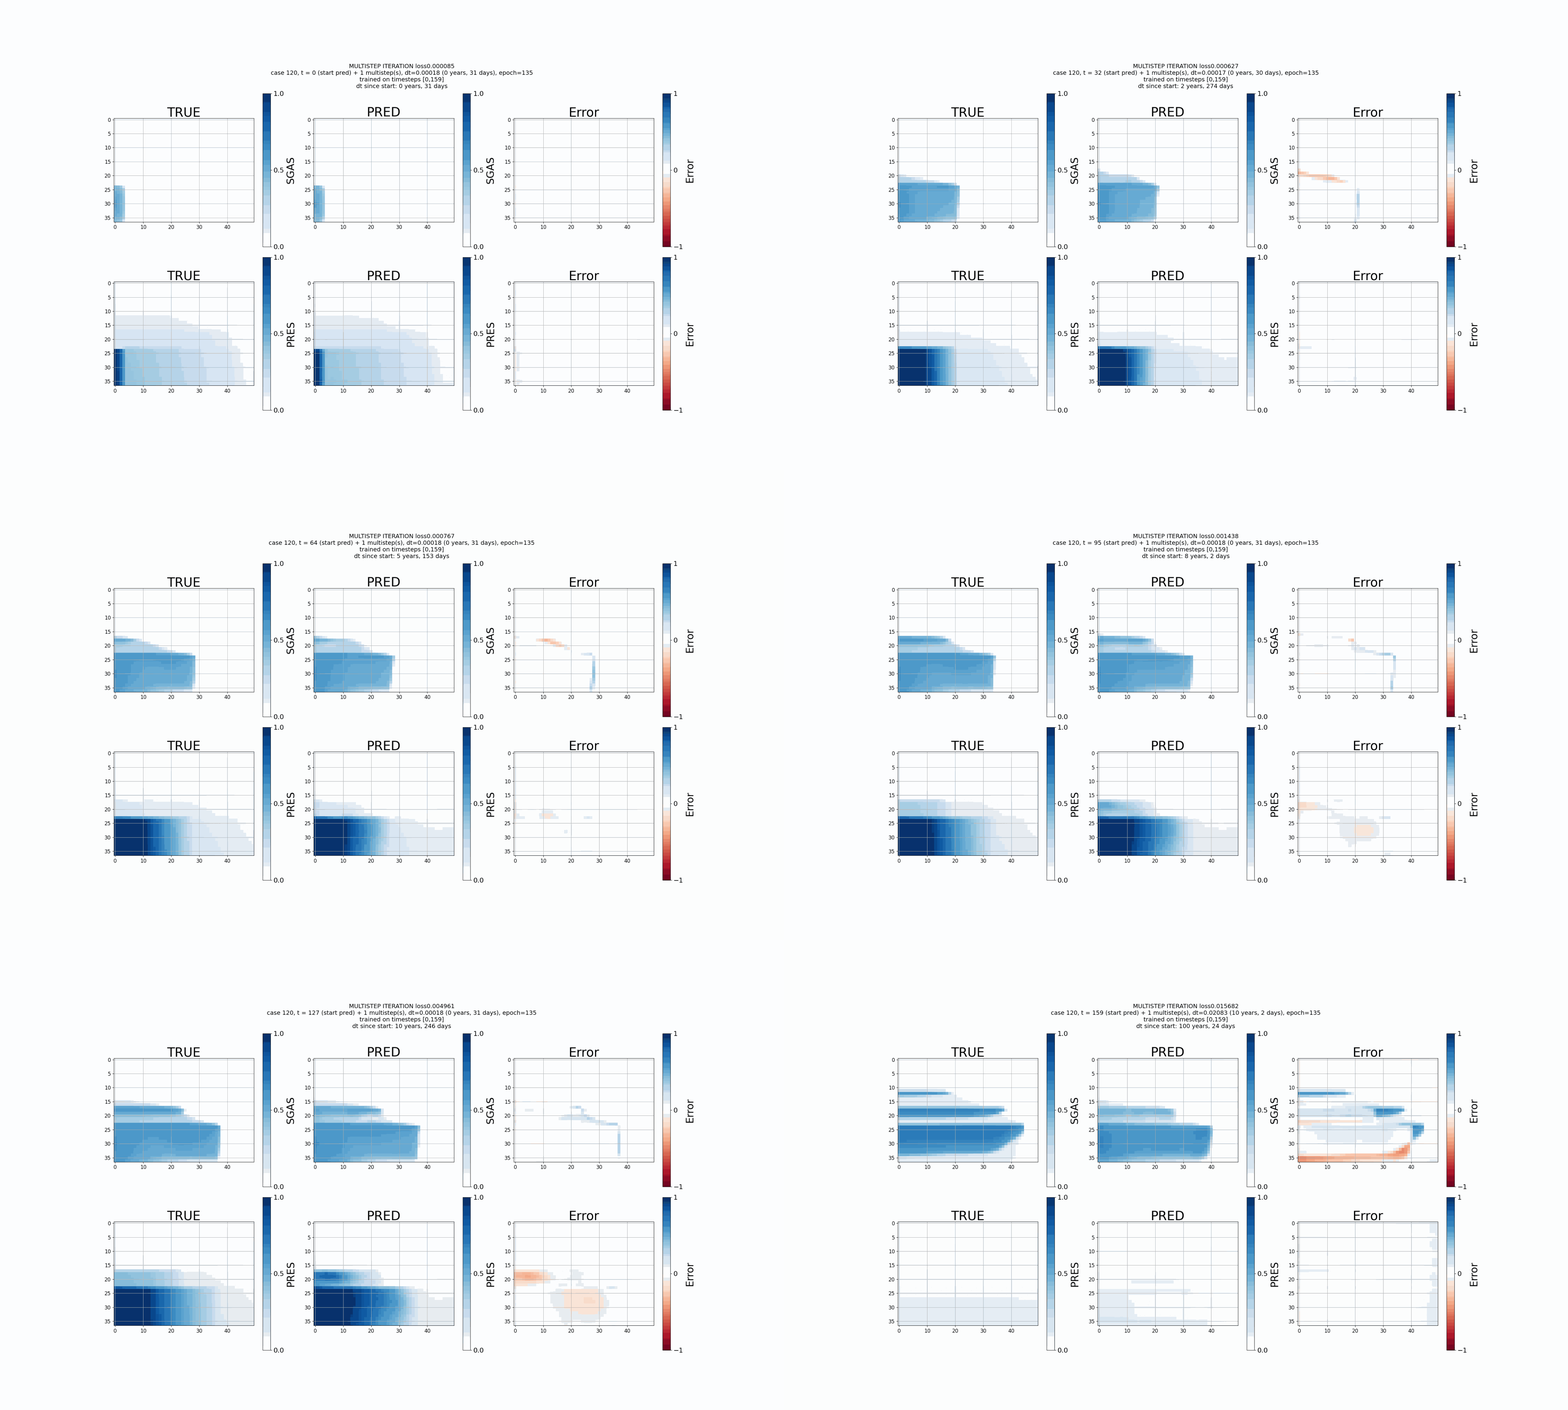
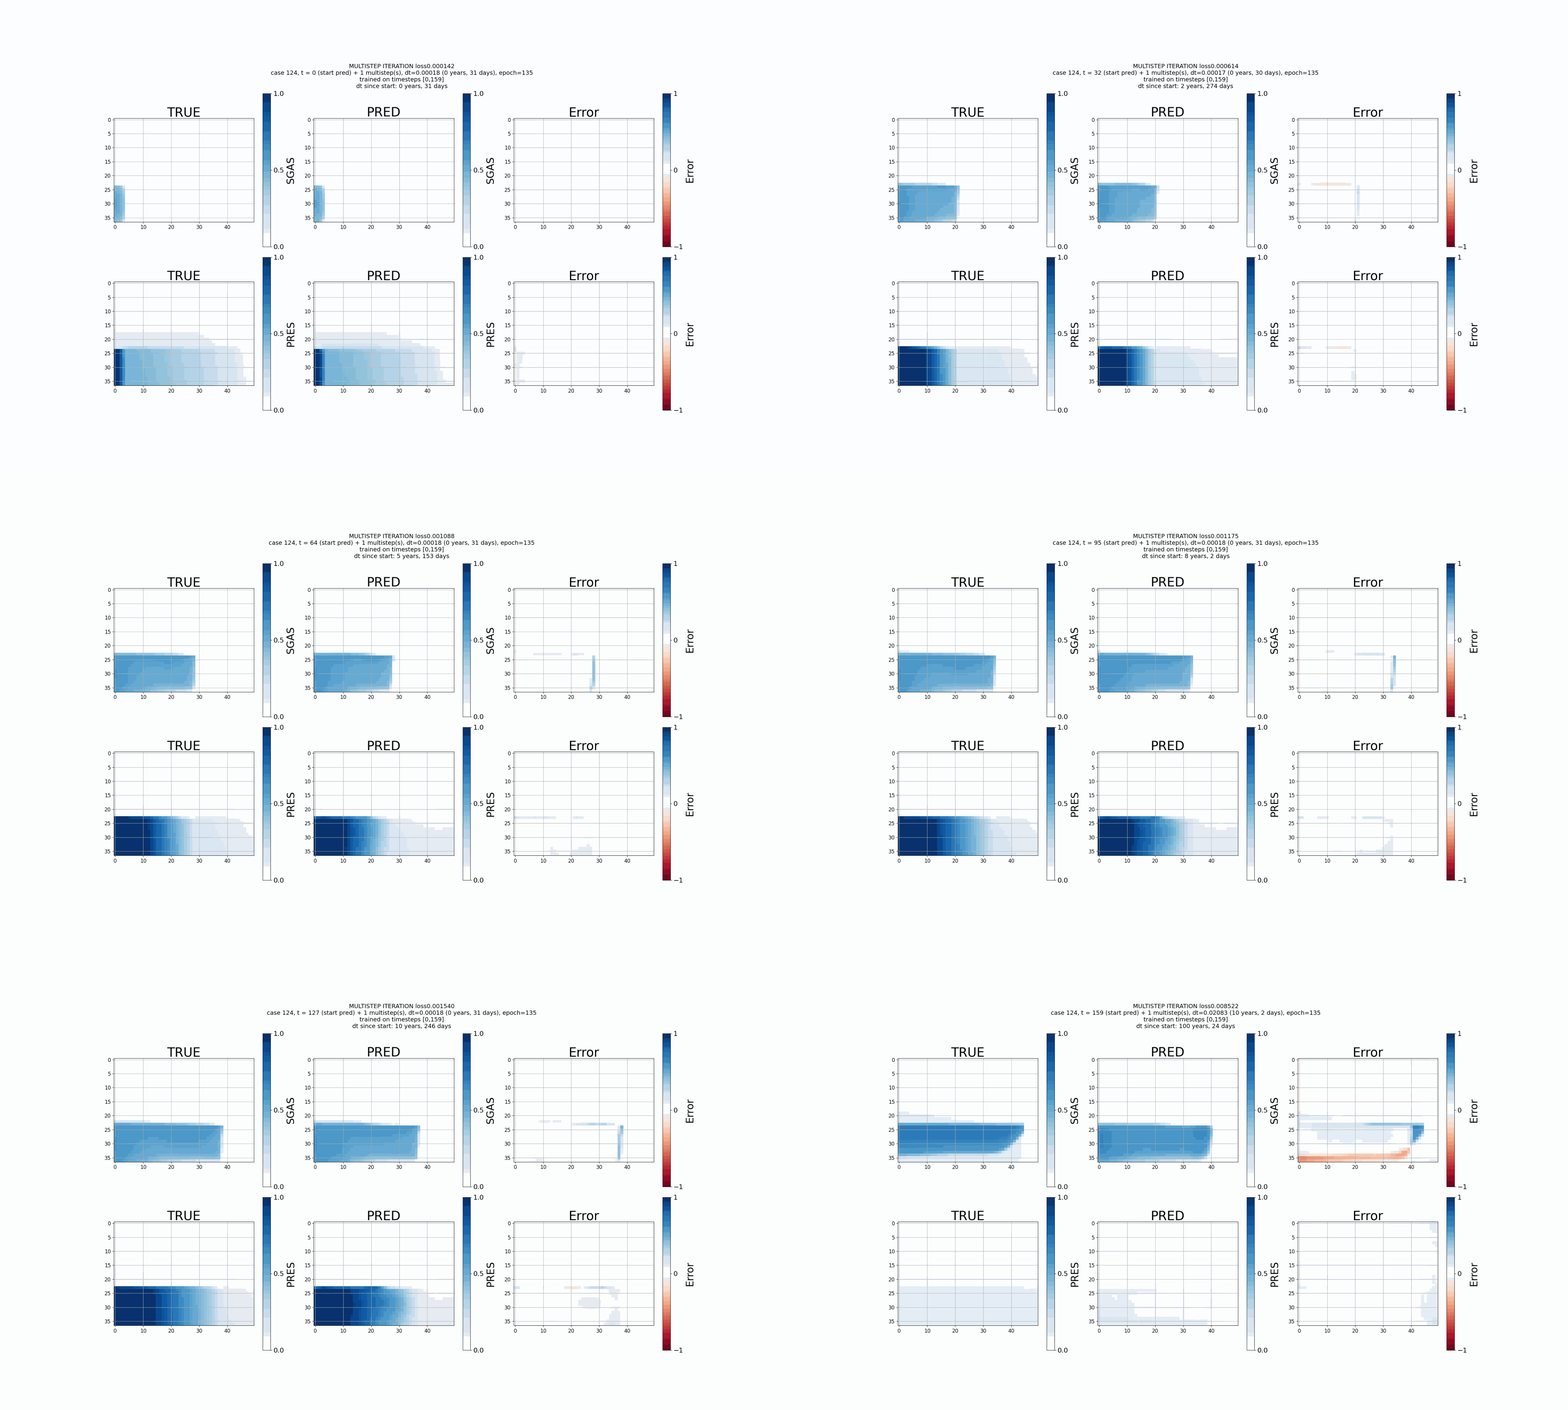
For illustrative purposes, the post-injection phase (>12 years) is included in these animations. See discussion in section 4.4.3, 5.5.2 and 6.2 for more details on this part of the simulation and why it is not yet captured properly.
(Figure 5.4 & 5.5)
Case 108
Case 116
Case 120
Case 124
Value bounce
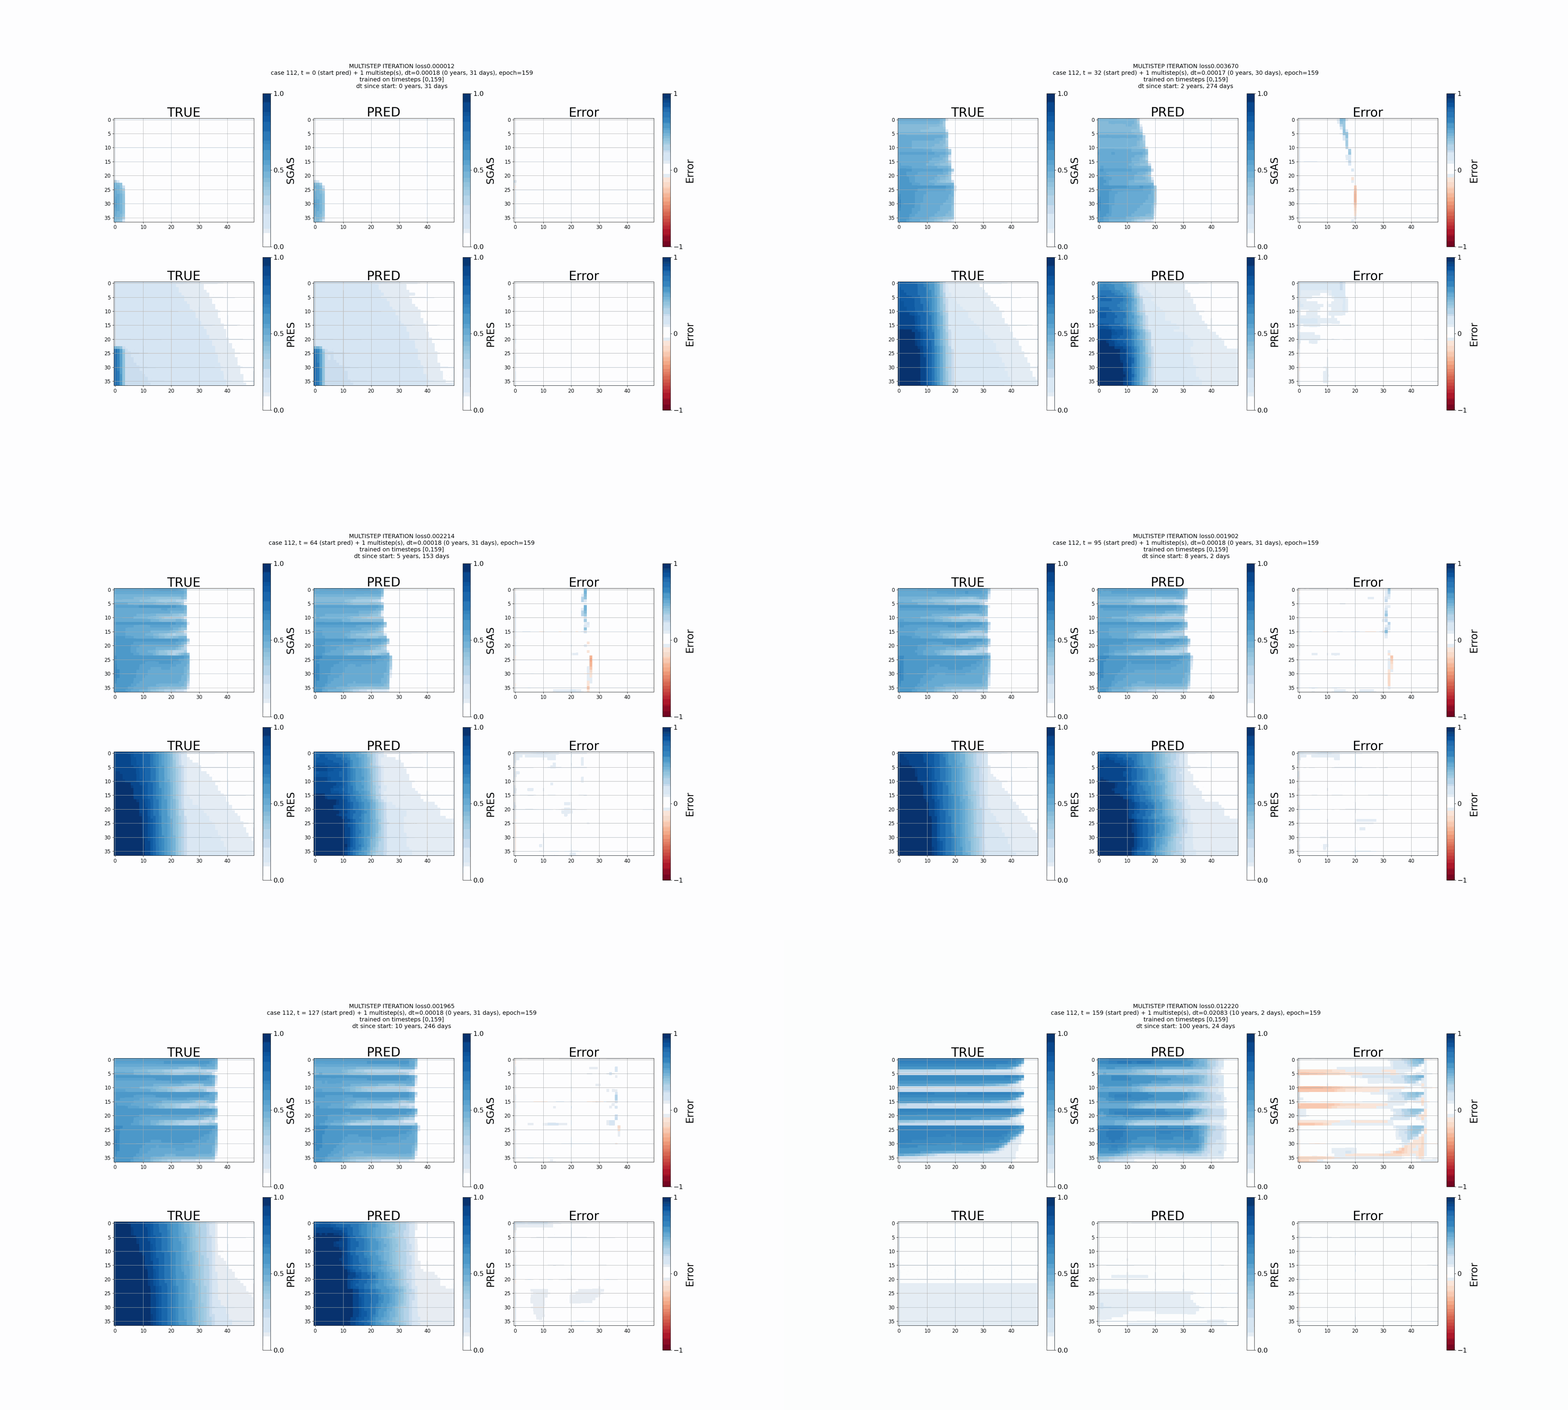
In the roll-out animation the value bouncing described in the thesis (section 5.5.1) can clearly be observed.
(Simulation corresponding to data from Figure 5.8)
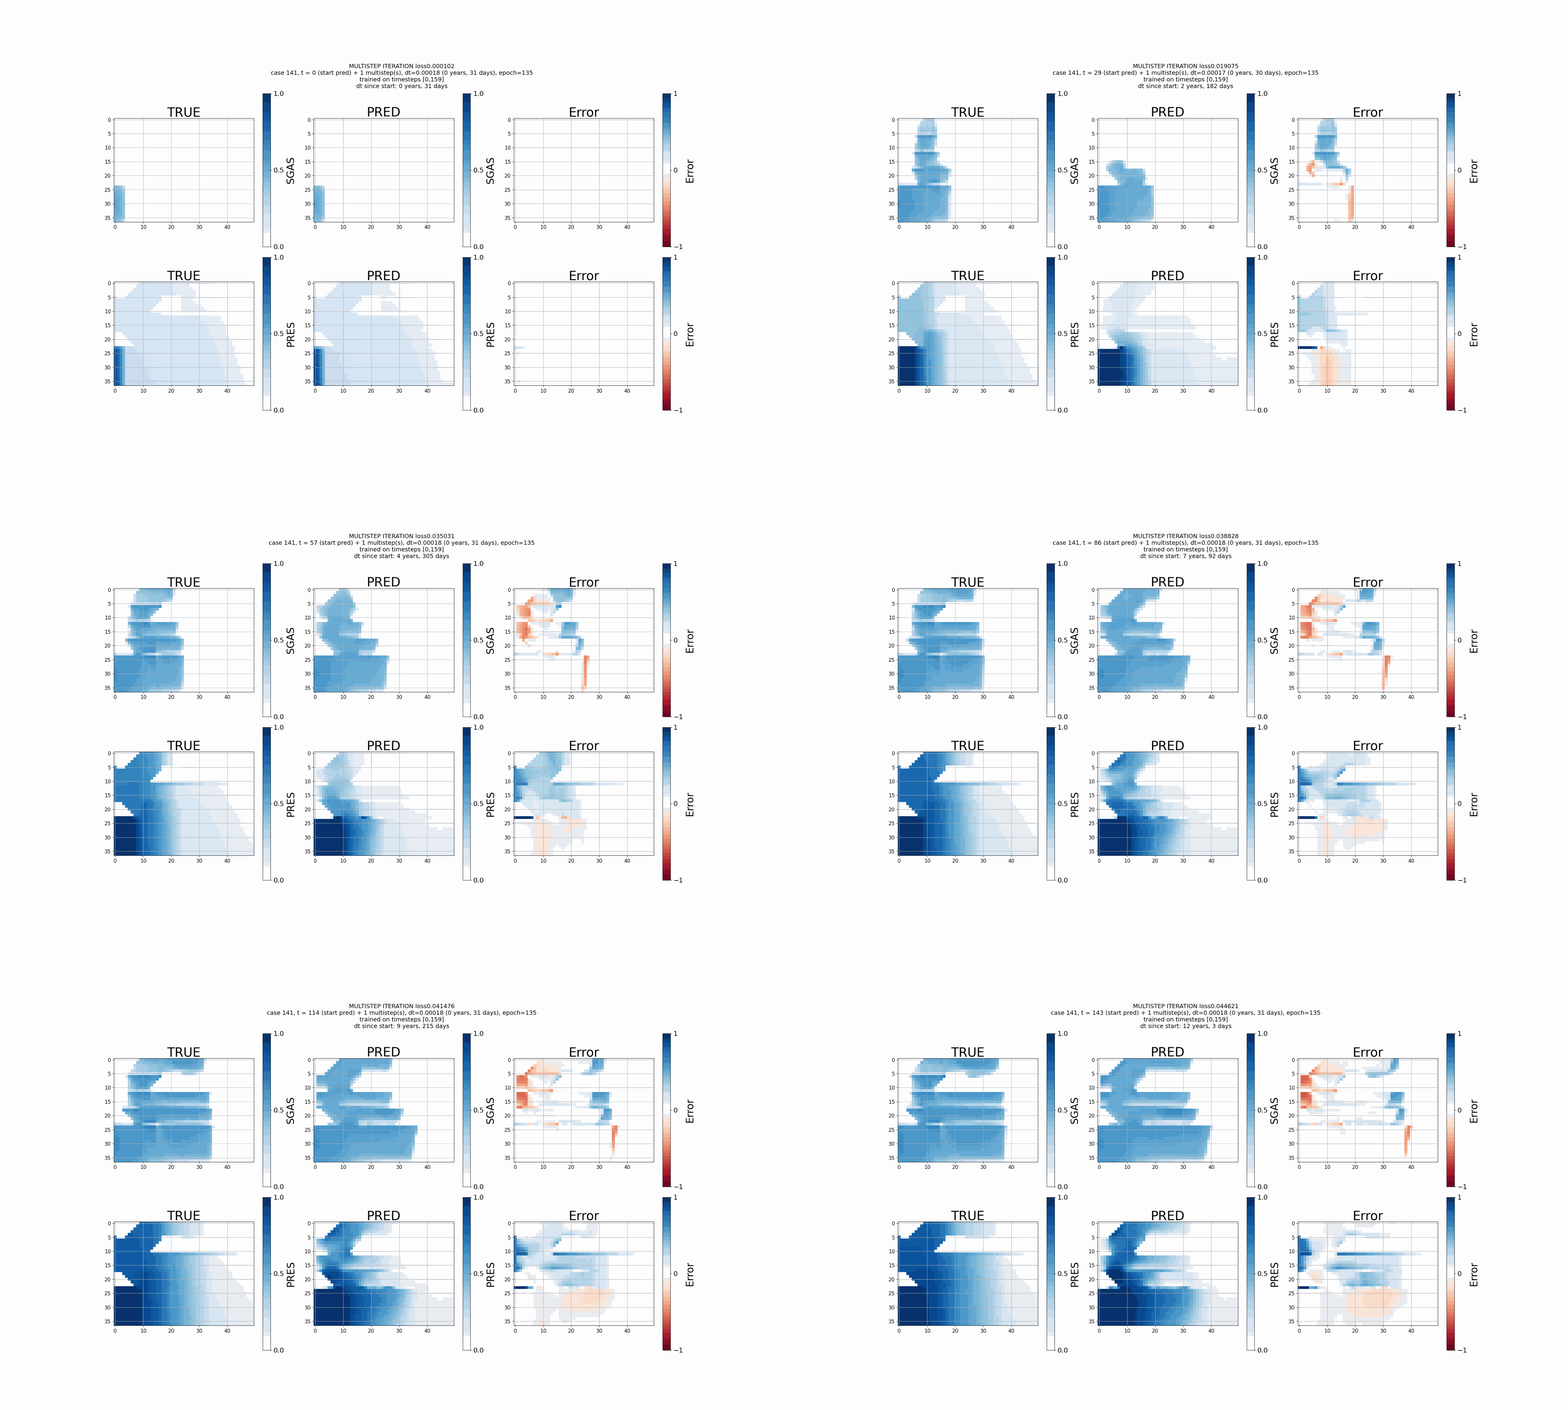
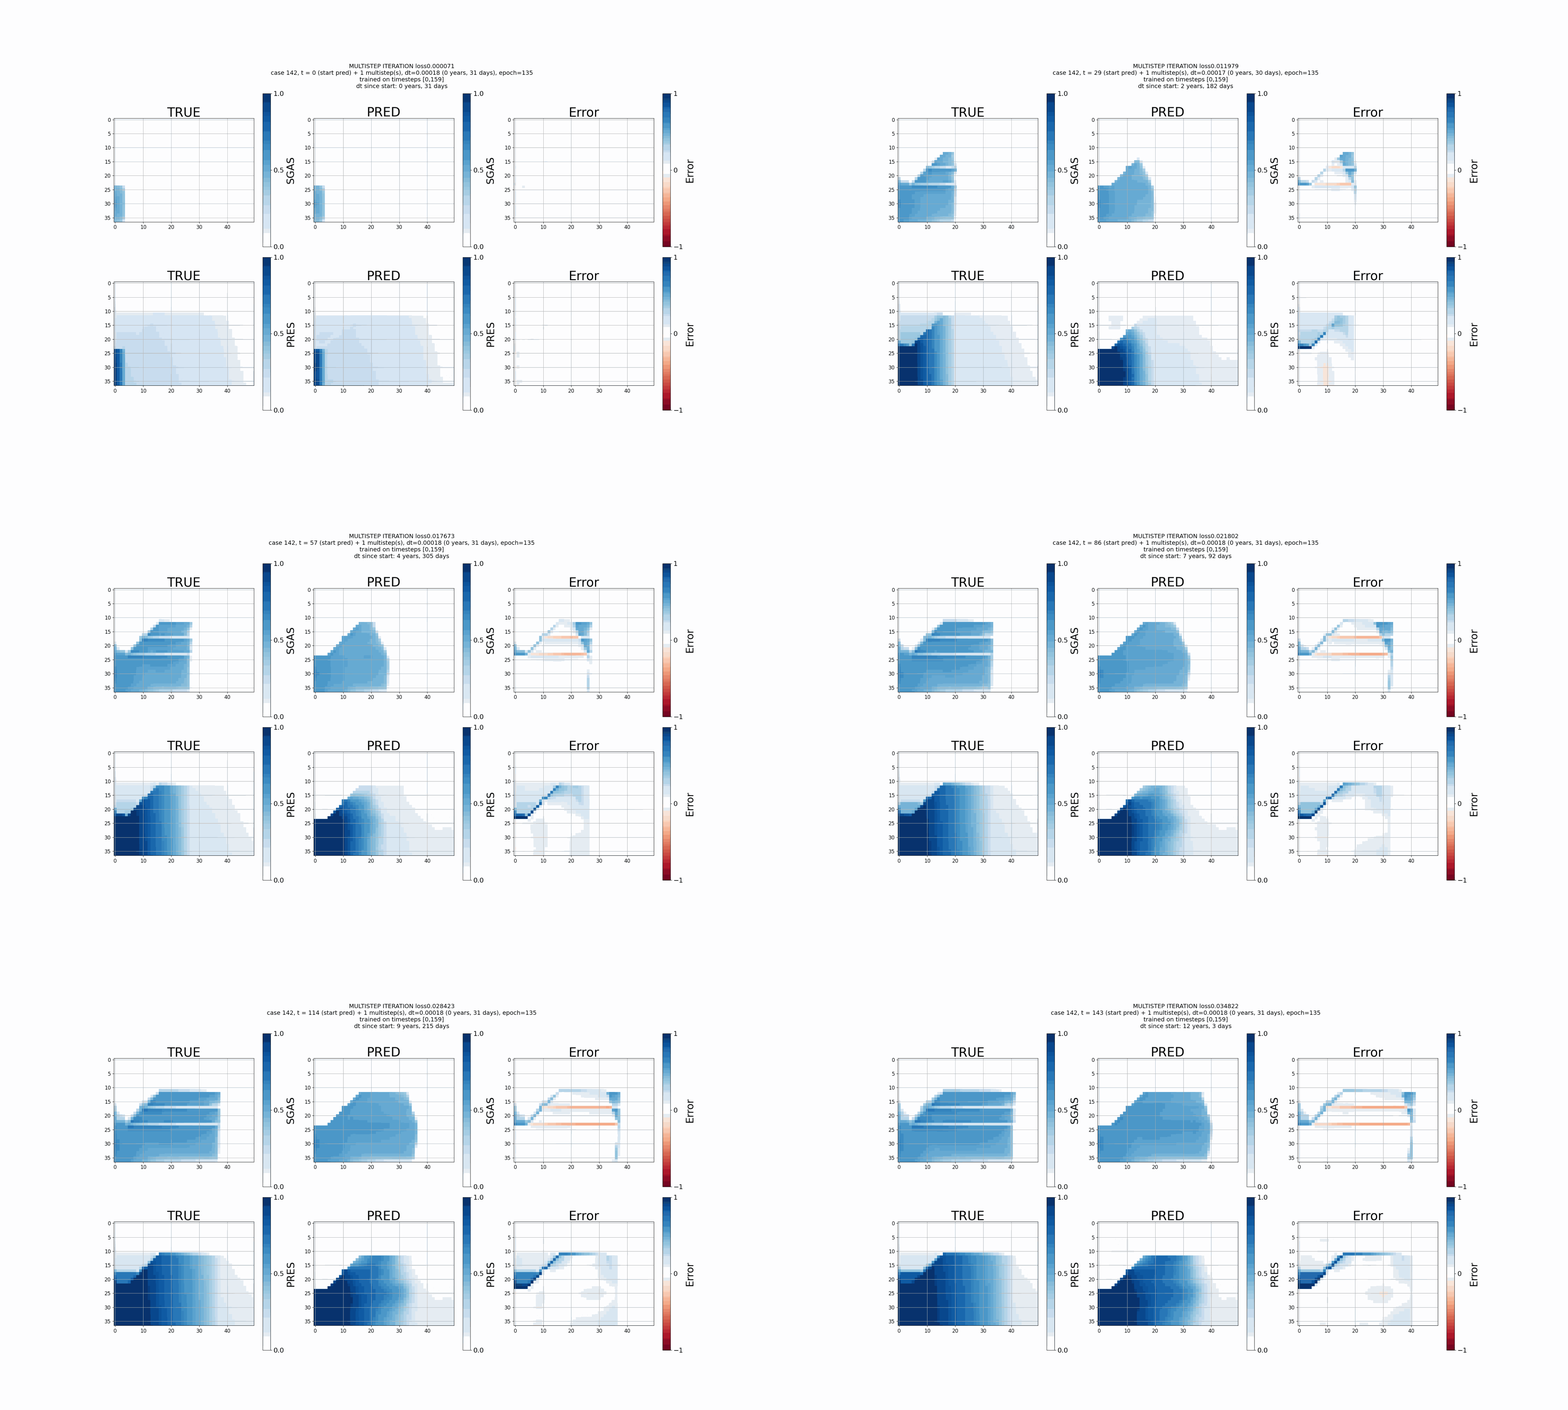
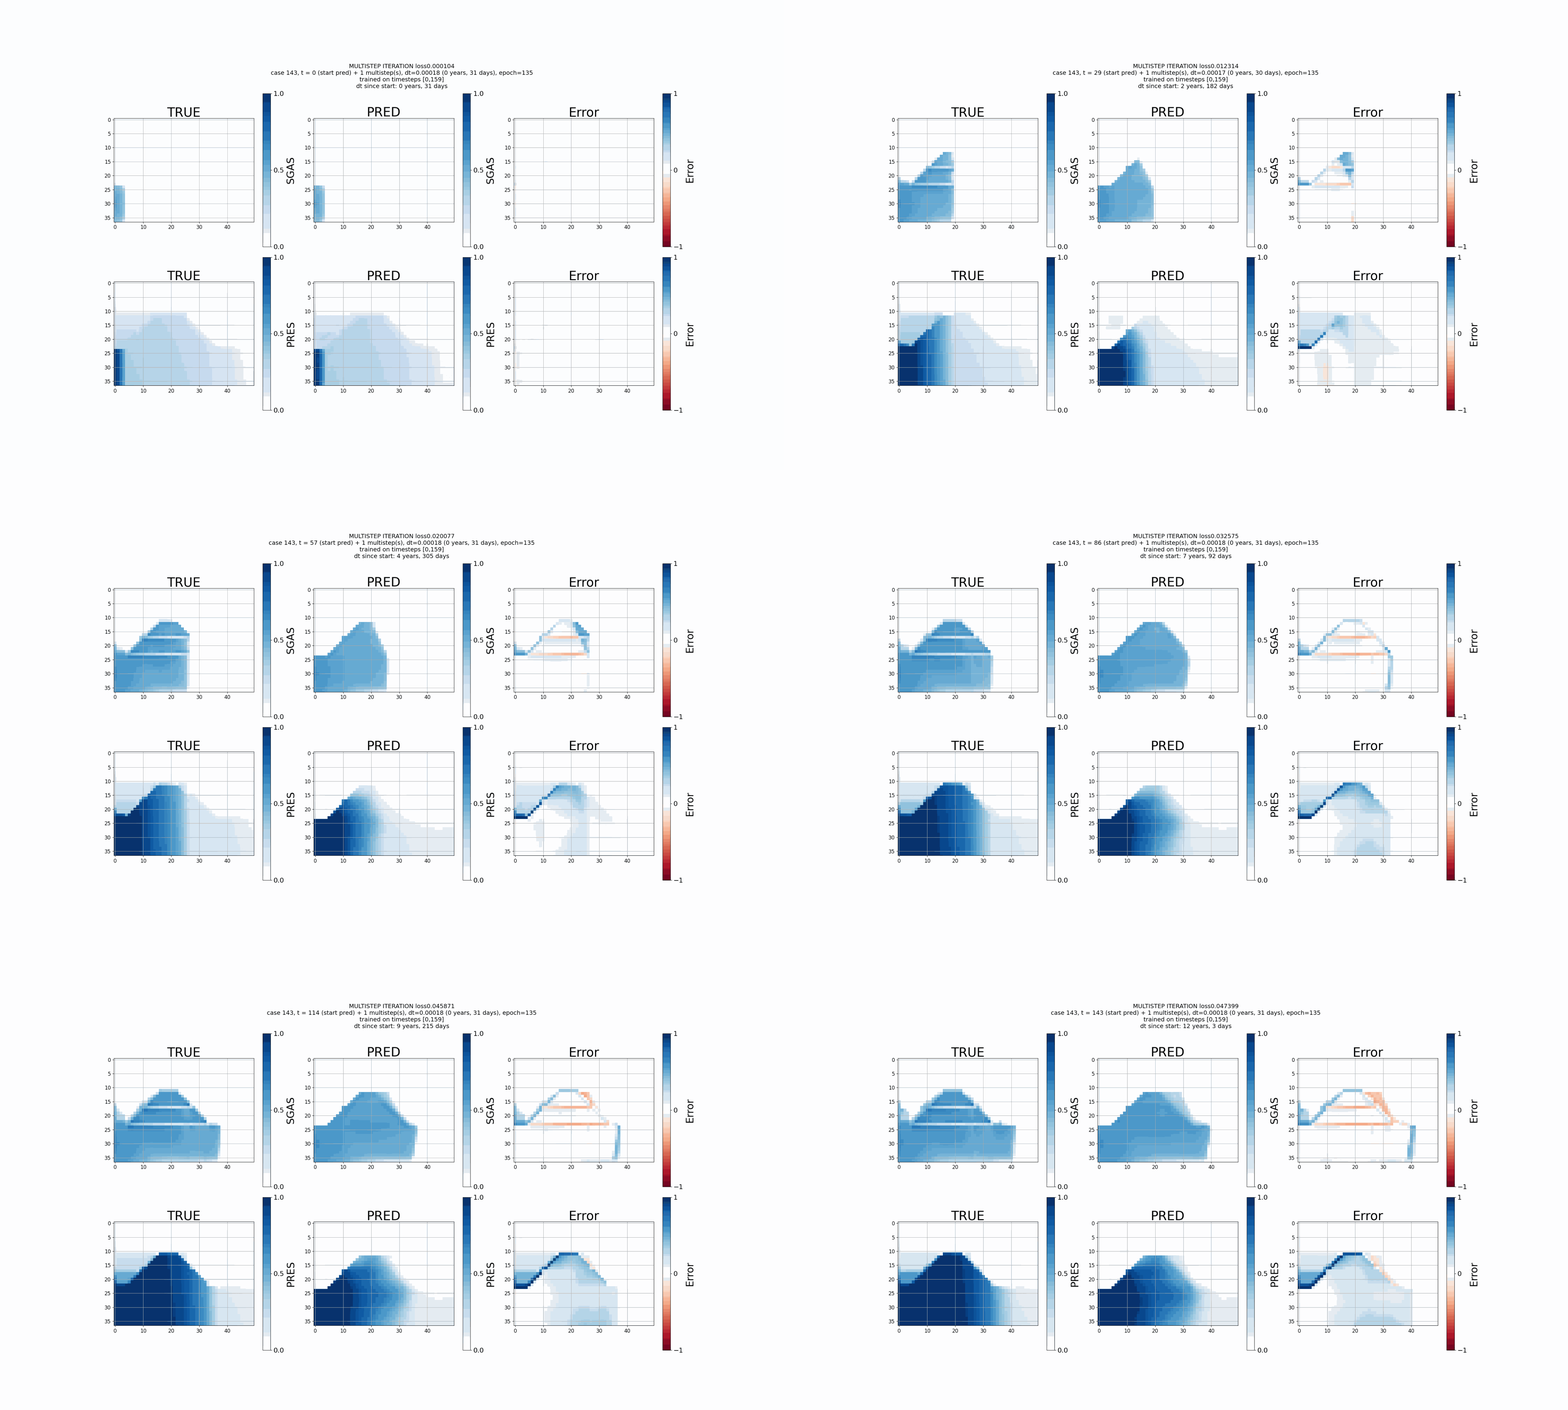
Unseen / Untrained structures
(Figure 5.11 & 5.12)
Reservoir A
Reservoir B
Reservoir C
Contact: ljjveeger@gmail.com m
In [ ]: